Recommendation: Short (Initiation of Coverage)
€ --
2016E Normalised FCF (adj. for medium-term customer financing)
€ --
€3.7bn
49%
~~
Investment Thesis
- Wirecard is a leading player in a fast-growing market which is likely to commoditise in coming years, putting pressure on revenue growth and margins.
- The income statement does not reflect the full cash economics of the business. FCF is negative if adjustments are made for capitalisations (i.e. operating expenses), sales partner financing (i.e. working capital) and acquisitions (i.e. growth capex).
- Management’s focus on EBITDA as the key business KPI ignores key costs of growing the business (namely capitalised R&D, capital investment and partner financing). Management‘s variable compensation is based solely on share price performance, which always concerns us as investors.
- Valuation is at a significant premium to market, peers and recently announced comparable transactions.
Low Barriers to Entry
Wirecard is a European-based electronic payments processing company. It has four main activities:
- Payment processing and risk management of electronic payments;
- Credit card acquiring, providing acceptance of transactions through Wirecard Bank AG;
- Issuing credit cards and prepaid cards; and
- Call centre activities.
Wirecard sits in the middle of the supply chain. Visa and Mastercard are the main upstream suppliers, and looking downstream the customers are e-commerce businesses (primarily within the travel, consumer and digital goods sectors).
- As customers grow, they receive volume discounts. This is evidenced by 90%+ of Wirecard’s customers by number (source: Bloomberg Q4’11 conference call transcript) being in the consumer sector, driving a revenue share from consumer which is higher than the transactional €bn volume share (43% Q1’14) due to better pricing dynamics for smaller merchants.
- The opposite is seen in travel (23% volume share Q1’14) and digital goods (34% volume share Q1’14) where the merchants tend to be of greater scale (e.g. airlines and major online leisure operators) leading to greater customer concentration and therefore they pay less as a percentage of a transaction.
- The main differentiation that Wirecard, as a European market leader, ultimately has is with regards to additional services such as risk management which it can provide to a merchant/acquirer and that it is also has a bank which allows it to be an acquirer. Ultimately these businesses should become less of an advantage as technologies mature and due to the principal membership agreements for merchant acquiring which MasterCard Europe and Visa Europe are signing with payment processors (e.g. Optimal Payments in January 2014).
- Visa and Mastercard are in the strongest position in the chain and have the strongest pricing power.
- We note how competitive the industry is. As an example, Demandware, a provider of enterprise cloud commerce solutions, lists over 170 partners on its website (see here), of which a large number are payment related providers (e.g. Accertify, Bongo, Boom! Payments, Optimal Payments, PayOne, Skrill, Verifone, WorldPay).
There is some evidence of pricing pressure in some areas of the payment processing market.
- Sage reported pricing pressure in its US payments business in Q2’14 (calendar year).
- Whilst Wirecard is not active in the same US market as Sage (it services from our analysis higher-risk customers such as an airline, and is an acquirer whereas Sage is simply a processor using other acquirers such as BMO, Wells Fargo and Chase Paymentech) we see little defence to gross margin pressure if this trend was to become prevalent in Europe and there is pressure on the commission rate of the transaction.
We estimate the payment piece of the chain takes 1.5% to 3.0% of the total value of the online transaction, with the largest share going to Visa and Mastercard (usually 0.7%, source: WorldLine 2013 Registration Document). For reference, Wirecard’s total revenue (Q1’14) is 1.7% of processed volumes – excluding recently-acquired businesses such as Newcastle Building Society’s cards business and many, if not all, the Asian businesses which operate different business models would yield a revenue over processed volumes number of 2.0% to 2.2%, in line with what Wirecard reported historically.
Exhibit 1
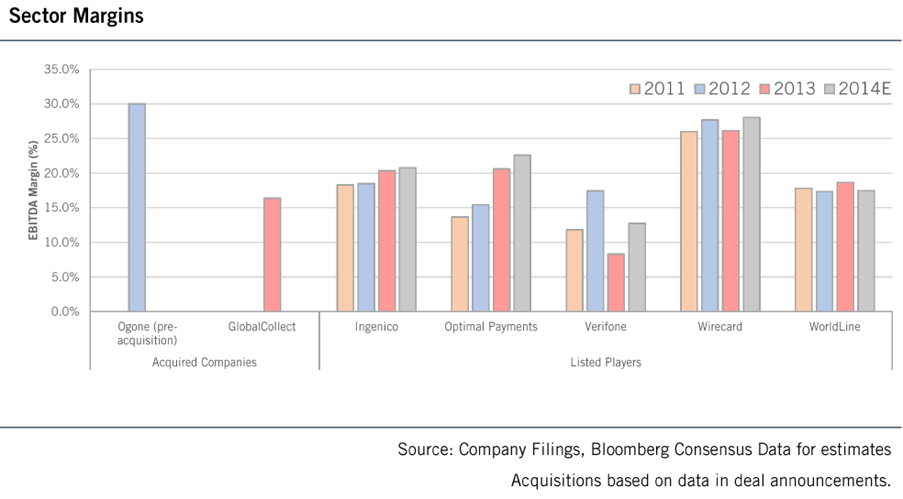
Sector Valuations
We are concerned by inflated valuations across the payments sector, in particular with regards to mobile payments – both in the listed world and the implied valuations of funding rounds of start-ups.
The mobile sector is clearly disruptive, but we do not see businesses in the middle of the supply chain generating above average levels of profitability long-term. Wirecard is also making significant investments in mobile to support many players, mainly MNOs, which is depressing profitability and, more importantly, FCF as much of the development is capitalised. Our view is that mobile will not lead to superior incremental returns on sales and capital for Wirecard.
- Monitise, which is yet to make a pre-tax profit, has changed its business model a number of times, has raised a significant amount of equity and has pushed its strategic targets out to FY’18.
- Square, a US payments processor with some overlap to Wirecard in terms of enabling mobile and tablet devices, achieved a valuation at its last funding round of $5bn (Source: Financial Times, 14.01.14).
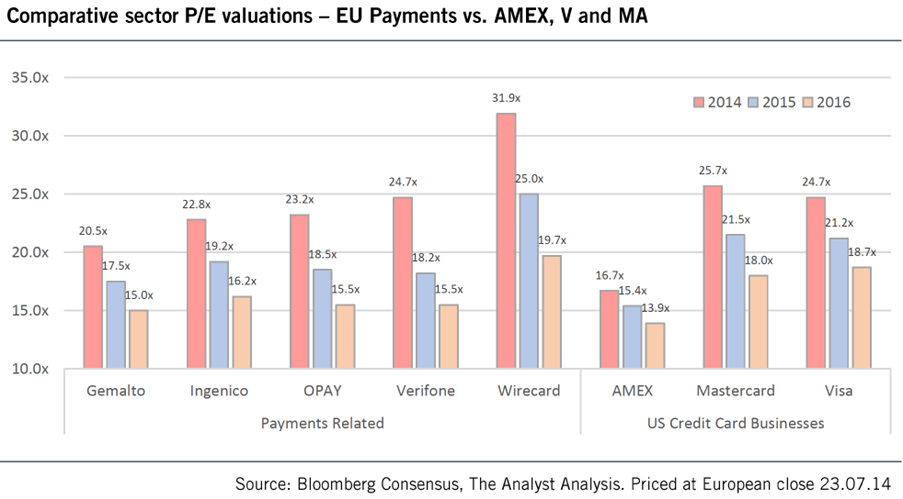
We see the ultimate winners in the payments world as Visa and MasterCard where the pricing power and moats around the businesses are significant. Mobile wallets may provide some competition here, but they are still often utilising Mastercard and Visa infrastructure packaged as a wallet, meaning the economics for mobile are not particularly different for Wirecard which still takes its acquiring and processing fees of these transactions.
Wirecard is rated at premium multiples to Visa and MasterCard as shown below, yet the economics of the business is worse in terms of margins and cash conversion. They are also less dominant in their industry segment, with smaller technology moats around their business.
Exhibit 2
Wirecard’s key competitors in Europe have historically been Worldpay, Ogone and GlobalCollect which have now been acquired or are in exclusive discussions about being acquired.
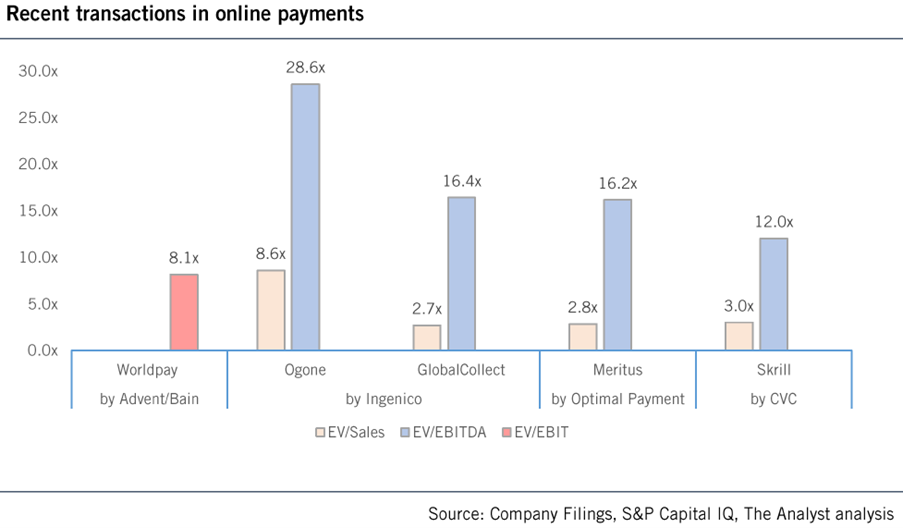
- Worldpay was sold by RBS in the summer of 2010 to Advent/Bain Capital for an EV of £2.025bn. Worldpay generated an operating profit of £249 in FY’09 implying an EV/EBIT multiple of 8.1x.
- Ogone was bought by Ingenico in 2013 for an EV of €360m from Summit Partners. This implied a valuation of 8.6x EV/Sales and 28.5x EV/EBITDA (based on 30% EBITDA margin)
- GlobalCollect is currently in exclusive discussions to be acquired by Ingenico Payment Services for €820m. This implies EV/Sales and EV/EBITDA valuations of 2.7x and 16.4x respectively.
- In addition, Optimal Payments acquired Meritus Payment Solutions, a payments platform provider for US based merchants, for EV/Sales and EV/EBITDA of 2.8x and 16.2x respectively in July 2014.
Wirecard trades at a premium to the most recent two announced transactions. We do not think a listed equity should trade at a premium valuation to a change of control transaction.
Exhibit 3
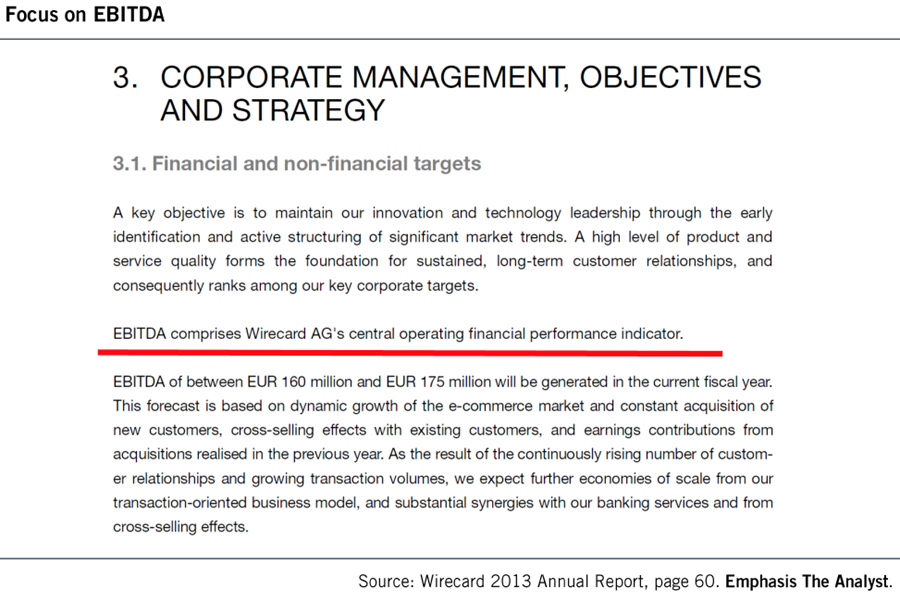
EBITDA Management and Share Price Compensation
Management’s primary financial target is EBITDA and EBITDA growth (as shown in the extract from the annual report below). This is not uncommon (Gemalto and Ingenico guide to either absolute EBITDA or EBITDA margin targets), but it ignores many of the real costs of the business as we detail below.
Exhibit 4
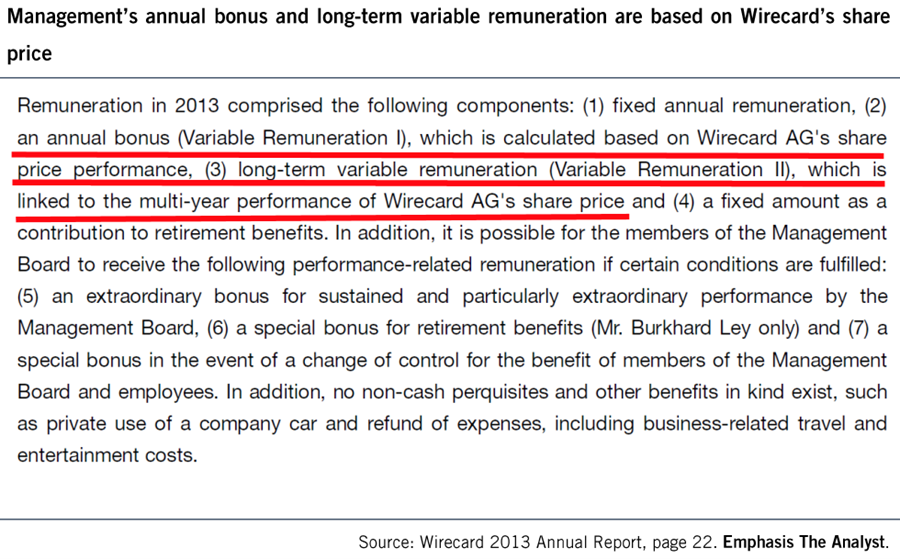
Management’s variable remuneration, both annual and long-term, is entirely based on share price performance (as shown in the extract from the annual report below). This is a double-edged sword: it does mean that management’s interests are aligned with those of shareholders, but it also creates the temptation towards short-term management of guidance, expectations and published P&L numbers (the primary focus of most in the investment community), at the risk of sustainability and cash-flows.
Income Statement Excludes Many Cash Flow Items
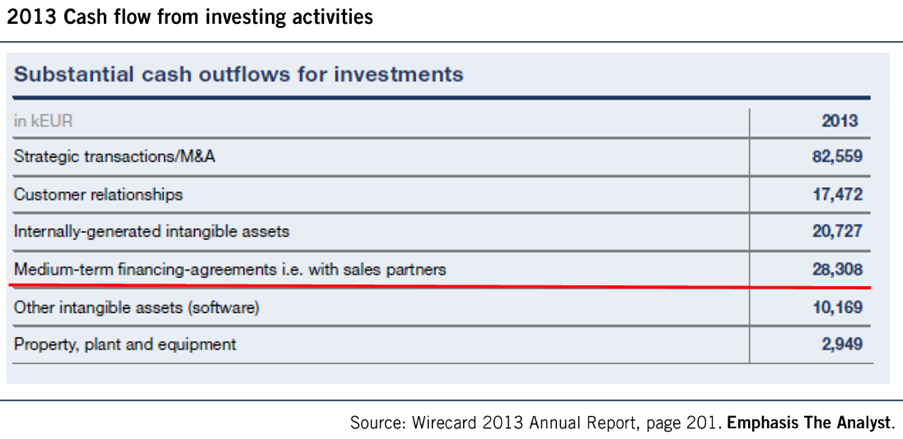
The exhibit below shows Wirecard’s cash flow statement from the 2013 annual report.
Exhibit 5
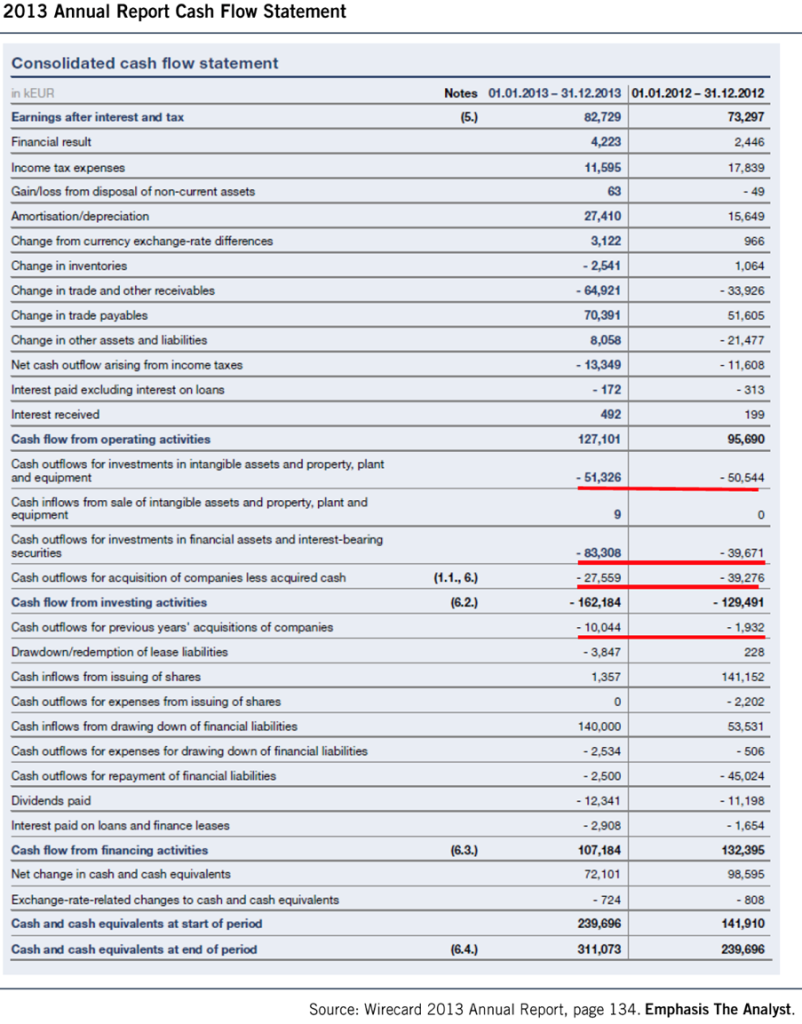
We highlight the following three points:
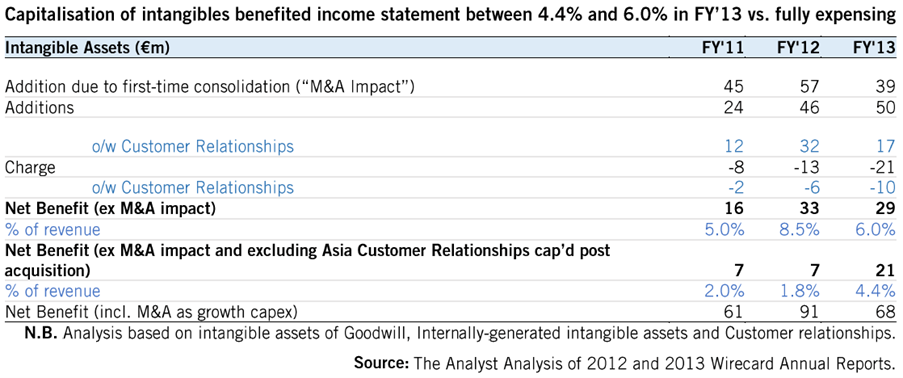
1. Capitalisation of internally-generated intangible assets and customer relationships relative to the associated amortisation charge. The adjustment to be made is €29m (€50m of additions against €21m amortisation, equivalent to ~6% of 2013 revenue) if fully adjusting for Asian customer relationship payments completed post acquisition or €21m if acquisition-related expenditure (defined by us as Customer Relationship intangible) is excluded from the net capitalisation benefit to the income statement, equivalent to 4.4% of sales.
Wirecard amortises customer relationships from cost value on a straight-line basis of useful lives of 10 or 20 years (Source: 2013 Annual report), internally-generated software for payment platform and “Mobile Payment” projects over 10 years ( Source: Q1’14 report), straight-line basis and purchased software is amortised on a straight-line basis, over three to 10 years (Source: Q1’14 Report).
- Optimal Payments, a close peer, amortises intangible intellectual property on a straight-line basis over three to five years and website and platform development costs over useful life using declining balance method at 30%.
- Ingenico amortises capitalised development costs over three to seven years, licences over three years, customer relationships over five to 14 years and other intangible assets over five years.
- Monitise amortises customer contracts over seven to eight years, purchase software licences over one to five years, intellectual property over seven years, acquired licences over seven years, acquired technology over four to six years and capitalised development costs of three to four years.
Exhibit 6
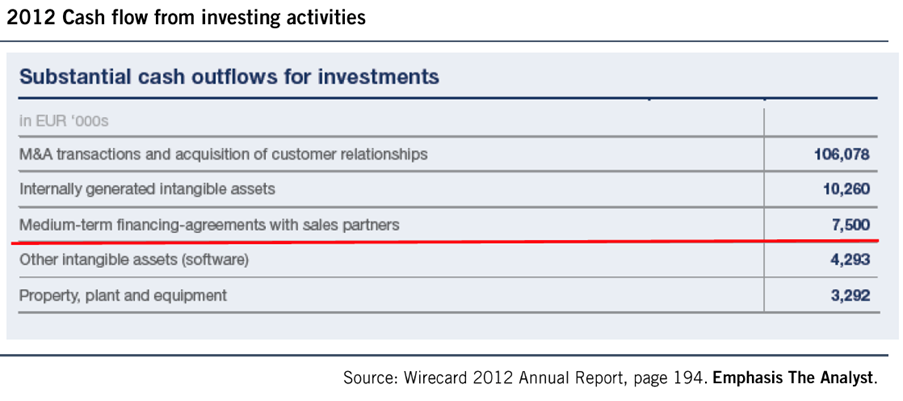
2. ‘Cash outflows for investments in financial assets and interest-bearing securities,’ which amounted to €39.7m (2012) and €83.3m (2013). The exhibit below shows the split in further detail. Our main concern is around the ‘Medium-term financing-arrangements i.e. with sales partners’ which appears to be the extension of loans/financing to affiliates for funding purposes, who in turn generate traffic and revenue for Wirecard.
There is little detail on this item in the annual reports (2012 and 2013) looking at the economics of the transaction. The Q1’2012 transcript (Source: Bloomberg) did give an overview of the sales partners process and how it works.
Question:
“And the other question I have is more detail, in your cash flow statement, you say €7.5 million investment for medium-term financing agreement with a sales partner, may be you can give us a bit of background information here.”
Answer (CFO Burkhard Ley):
“7.5 million are related to the growth in Asia and distribution partner arrangement making it possible that via distribution partner, the growth with regard to classical B2B business can be accelerated in Asia and the payback of that, of course, is directly linked to the cash flow of the customer transaction volume covered by Wirecard Group, thats the figure you asked for in.”
Follow-up question:
“Yeah, sorry to interrupt you. Did I miss that? So, youve paid €7.5 million to a distribution partner, and he has to deliver on bringing new business and then he can keep the money, otherwise he has to pay back?”
Answer (CFO Burkhard Ley):
“He has to pay back with the cash flows of the customers”
“He as a distribution partner brings to our platform”
“That’s a typical arrangement we have in those areas where you see potential to grow faster with distribution partners. You know from the past, we always have a mix between direct approach and indirect approach to customers and that’s a typical example to this indirect approach.
We are currently investigating this number further, but at a minimum on our model it needs to be treated as working capital and taken out of adjusted operating (which it is not by management) and free cash flow. The cumulative investment in this area of €36m also needs to be looked at in the context of the Other Countries (ex Europe, ex Germany) segment revenue of €140m and EBITDA of €40m in 2013.
There is little detail on this item in the annual reports (2012 and 2013) looking at the economics of the transaction. The Q1’2012 transcript (Source: Bloomberg) did give an overview of the sales partners process and how it works.
Exhibit 7
3. The acquisition spend is significant and seems to be ongoing, so for our model we would tentatively classify this as growth capex and adjust the net investments and deferred considerations for cash flow calculations.We view M&A expenditure as accelerated growth capex. Wirecard is rapidly acquiring front-end businesses across Asia to acquire customer relationships. In turn, the company can then sell-in and cross-fertilise these acquired companies with their technology, products and solutions. However, the business acquired are small by nature (recent M&A deals EBITDA guidance from deal press releases is PT Aprisma €6.5m, PaymentLink €2.5m, Trans Infotech €2.5m) and are bringing network and scale to the business, rather than technology. Of the combined asset sides of the balance sheets of these three transactions 67% was for customer relationships and only 6% was derived from other non-current intangible assets (i.e. intangibles which are not goodwill or customer relationships).
Exhibit 8
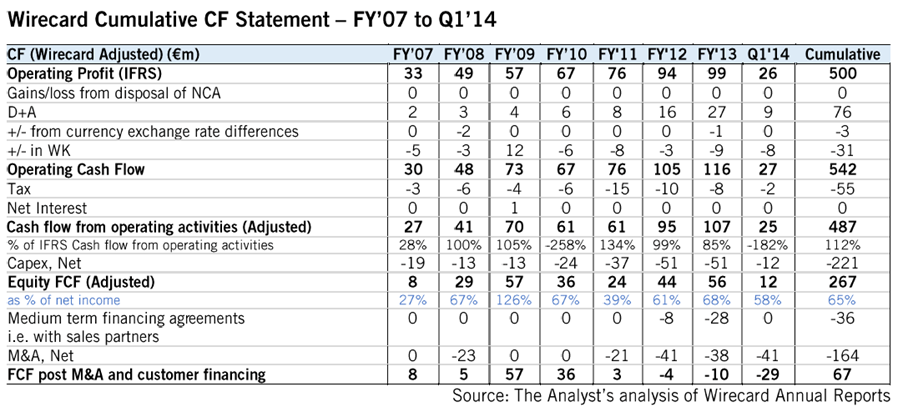
Taking these three items (capex, medium-term financing and M&A) and deducting from the ‘Cash flow from operating activities (adjusted)’ of €95m (2012) and €107m (2013), implies Wirecard is a cash flow negative business currently as the LTM FCF, post M&A and medium-term customer financing, is an outflow of €33m.
There is nothing wrong with growing through acquisitions, and indeed many of our favourite long ideas have acquisitions built into the investment thesis (ASSA ABLOY, Arcadis) but Wirecard has diluted equity holders in both Q1’12 and Q1’14, raising close to €500m of equity, despite as we show above being cumulatively FCF positive since FY’07 even after taking into account M&A and medium-tern financing. Clearly the ramp-up of investment has accelerated over the past three years which may explain the need for the equity raise.
Estimates Assume Acceleration of Organic Growth
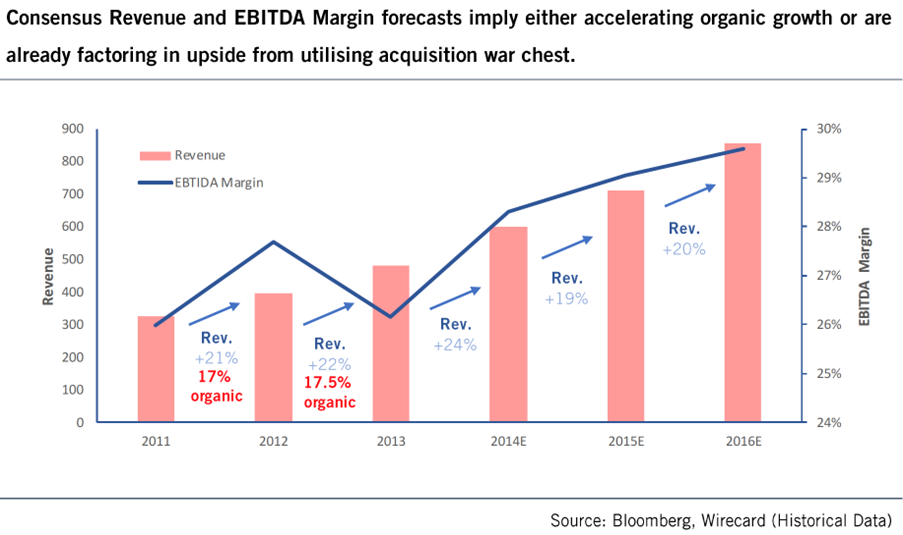
According to Bloomberg, consensus forecasts have:
- Revenue growth of 19% for FY’15 and 20% for FY’16. This could already be factoring-in some acquisitions given trend organic growth has been 17-19% in recent years, or simply assuming that mobile accelerates growth.
- EBITDA margins expanding from 26% in FY’11 to 29%-30% by FY’16.
- EPS growing at a 2013 to 2016E CAGR of 26%.
Overall, we see the risk of upside to estimates from an organic basis as relatively low. Consensus estimates for FY’14 have been coming down in recent weeks, according to Bloomberg.
Exhibit 9
Risks to Shorting/Selling Wirecard
- The market in Europe is growing at least 10-12%+, and is growing more rapidly in Asia. Wirecard are outpacing this growth organically and can also add on the M&A (last reported sales growth of +25% in Q1, of which 19% was organic). This appears to be a growth company in a growth industry that investors are happy to pay premium multiples for.
- Wirecard has recently raised a war chest for M&A which could drive estimates upwards. Management raised equity in Q1’14 and has a significant war chest to invest in growth opportunities in the coming one to three years. Recent deal multiples for Wirecard have been for EV/EBITDA of 10x to 13.5x which would imply the potential for €52m to €70m of EBITDA to be added to the group through M&A. For reference, 2014E EBITDA guidance is €160m to €175m.
- Management is heavily incentivised on share price performance. Therefore, there is an EBITDA guidance and growth machine in place, and as long as investors (both buy-side and sell-side) remain focussed only on growth momentum and EBITDA guidance, the share price can rise. Without due attention to realistic valuation levels, the cash economics of the business and discounts appropriate for the risk factors discussed in this note, there may still be momentum behind the share price.
- Wirecard has global presence and a large suite of self-developed products and solutions. The capitalisation of €220m of customer relationships, the sales network, European banking license and thematic backdrop may appeal to an acquirer. That said, the special bonus clause in management compensation only accounts for a valuation up to €2bn, whereas the shares today are valued at €3.8bn. We feel a premium to this number would be unwarranted and completely out-of-line with other transactions in this space. Technology is changing rapidly, with an uncertain competitive landscape in the coming years.
Valuation Thoughts
For valuation purposes on earnings, we note the following points:
- We would adjust the reported EBIT margin of 20% to 21% by 4% to 6% to reflect the cash impact of the intangible capitalisation where the cash impact is not being fully reflected in the income statement.
- We also believe that as the industry matures that margins should trend down as merchants become larger.
- Ultimately, Wirecard on a cash EBIT basis could be a 10% to 15% margin business. We get there by the following calculation:
- Q1 operating profit margin of 21%.
- Adjusted for capitalisation benefits to the income statement of 4% to 6%.
- Balance margin of 15% to 17%.
- Adjust for some pressure in the industry on pricing as industry growth slows; we assume this is a further 2% to 5%.
- This leaves us at a balance of 10% to 15% for the industry to earn on a cash basis
- We note that peer GlobalCollect recently disclosed (source: Ingenico exclusive negotiations press release 02.07.14) 2013 gross revenue of €305m, net revenue of €111m (we assume this is equal to Wirecard’s gross profit) and adjusted EBITDA of €50m – a gross margin of 36.4% and 16.4% EBITDA margin vs. Wirecard at 42.9% and 27.8% respectively. Adjusting this for our estimate of likely depreciation and amortisation to sales of 1% to 3% of sales (Wirecard was 7.0% in Q1’14) and we show the margin for one of Wirecard’s close peers is already trading in our long-term assessment of what the industry should be earning on a cash basis of between 10% to 15%.
- The GlobalCollect deal is priced at 16.4x 2013 EV/EBITDA based on numbers which are now seven months out of date and we estimate that the GlobalCollect business is likely to be growing at 10% to 20%. This would imply a forward purchase EV/EBITDA multiple for:
- 2014E – 13.7x to 14.9x
- 2015E – 11.4x to 13.6x
- 2016E – 9.5x to 12.3x
We note that Wirecard trades at the following consensus EV/EBITDA multiples (Source: Bloomberg):
- 2014E – 18.0x
- 2015E – 14.7x
- 2016E – 12.0x
We see no reason why Wirecard’s current equity should be valued at or at a premium to a change of control premium multiple and, as we have already shown earlier in this note, consensus estimates appear to be already factoring-in either/a combination of: (i) accelerating organic growth; (ii) increase in mobile profitability driving up EBITDA margins; and (iii) acquisitions.
For the basis of our price target, we have attempted to look at the steady-state free cash flow of the Wirecard business.
- Over the last 12 months, Wirecard has generated:
- €120m of adjusted cash flow from operating activities;
- Invested €28m in medium-term customer financing; and
- Invested €47m in capital investment.
Effectively this is €44m of normalised FCF as we would define it.
- If we then assume,
- Wirecard can grow this normalised FCF at 18% in line with 12% market growth and 50% market outperformance; and
- 5% growth for M&A already achieved in FY’14.
We achieve 2016E FCF €76m or €0.61 per share of free cash flow.
At the current valuation, this implies a price to normalised FCF multiple of 49x. We would be willing to pay 20x to 30x for a high growth e-commerce business given we recognise it is a high growth asset. For reference, Mastercard and Visa sit on 2016E FCF multiples based on Bloomberg data of 17.2x and 19.6x respectively.
- Paying 20x to 30x for our normalised FCF definition of Wirecard implies equity fair value of €12.2 to €18.3. We pick €15.3 – or 25x our normalised 2016E FCF. We note that this is still at a premium to Visa and Mastercard so could still be overvaluing Wirecard relative to other industry players.
- If we exclude the medium-term financing and grow the FCF (i.e. adjusted cash flow from operating activities less capital investment) driving a base LTM number of €73m then growing that as above, at 20x to 30x FCF multiple, we get to share prices of €20.2 to €30.4 per share i.e. little, if any, upside from today’s current share price (€30.1). To achieve material upside, one has to believe that the acquisitions which Wirecard makes are significantly FCF accretive.
Conclusion
We think the payments industry is very competitive and that the valuations of payments businesses have similar valuation characteristics to prior trends in growth areas such as solar, telematics and wind in the past.
On balance, we feel an equity valuation of half the current share price (€15.3 – 25x normalised 2016E FCF) is more appropriate for this business, and believe we have enough conviction with the concerns raised in this note to issue a Short recommendation on the stock and highlight the following areas for further exploration:
- Extension of medium-term financing to customers in Asia and how recurring items of this kind are going to be in the cash flow statement.
- Use of affiliate and partner networks for traffic generation.
- History and quality of the acquired Asian businesses relative to the Wirecard Group.
- Verification of customer and partner references and exploration of Wirecard’s market presence, particularly in Asian markets, where we think further capital is likely to be deployed in coming quarters.
In addition, we are looking again at Gemalto and refer clients back to our notes highlighting the commodity nature of much of their business, the excessive valuation of the equity and the ongoing poor free cash conversion. We are overdue an update on Gemalto and are working hard to reinstate coverage on this stock.