Recommendation: Short (No Change)
£--
$20m
FY’20 EV/EBITDA
£--
£5bn
14x
~45%
NMC LN
10x
Investment Thesis
- Levered roll-up (underlying net debt/EBITDA: +3.8x) with organic growth slowing, poor cash conversion, unsustainable margins, and accounting and corporate governance red flags.
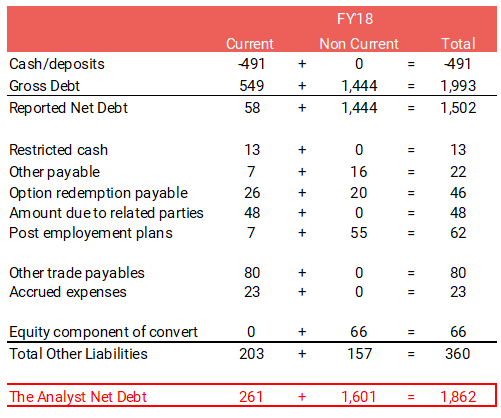
- Net debt is $1.5bn but that excludes ~$360m of other liabilities with over half due this year. Given the limited asset backing and high customer concentration, we see this as too high. NMC also runs with a high cash balance (~$500m) whilst the implied cost of borrowing is ~7%.
- NMC’s core markets (Abu Dhabi and Dubai) are maturing and saturated, which will likely dampen NMC’s growth going forward, and margins are likely to fall.
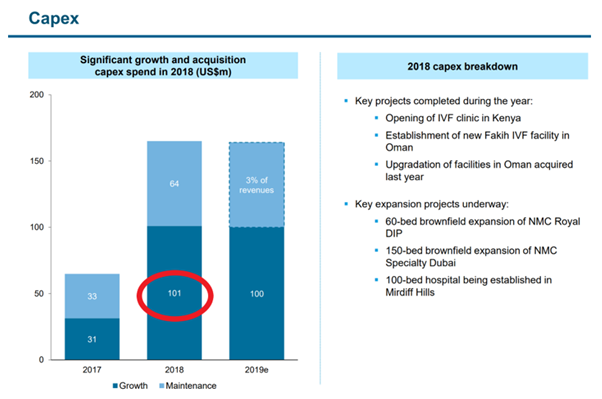
- We struggle to reconcile the $101m of growth capex reported for FY’18 with what we saw on the ground — which we calculate at no more than $30m. Historical cash conversion has been poor (45% of EBIT from 2013-18 made it to FCFF), although we acknowledge NMC has added capacity throughout this period.
- Given all these issues, NMC should trade at a discount to peers, on 10x EV/EBITDA for FY’20 to reflect these risks. We see ~45% downside from here.
A key part of our process is to actually get out in the field and see where the earnings power of a company comes from. With that in mind, we went on a site visit to the UAE. The company very kindly hosted us for part of this visit, on 19 June 2019. We update clients on this site visit and further work we have undertaken since we last wrote on NMC:
- Visited NMC’s six hospitals and three core construction projects, Mediclinic’s latest hospital, and had a meeting with the Health Authority of Abu Dhabi.
- Analysed the current capacity and planned additions to the market and looked closer at the insurance policies driving the market.
Overall, we reiterate our Short recommendation on NMC with a reduced target price of £13.50 providing ~45% downside.
Key Takeaways from Our Visit and Further Work
- In FY’18, NMC outlined bringing forward three core projects that led to much higher capex (8% of sales) versus reported maintenance capex (3% of sales). Our visit to these sites (19 June 2019) implies the work undertaken to date is limited and would have been even less at the time of results. Of the projects explicitly mentioned, we estimate no more than $30m of growth capex was spent on these projects relative to the $101m growth capex stated in the FY’18 presentation.
- Operational hospitals we visited were clean, well-maintained, and quite busy. The hospitals cater to a wide spectrum of the market, with NMC Royal Khalifa City targeting the local Emirati population and NMC Speciality Abu Dhabi more aimed at the volume expat market.
- Significant new capacity is coming in Dubai and there are signs of overcapacity in Abu Dhabi, so NMC is likely to struggle to maintain its very impressive margin.
- NMC’s increasing reliance on ‘Other Income’ is concerning. Whilst the annual report clearly states that this relates to advertising and promotion that is undertaken for its distribution partners at 11% of sales, it equates on our estimates to 33% of sales on the FMC goods it relates to. Importantly for FY’18, there was $33.9m additional ‘Other Income’, a 5x increase from $6.1m the year before — investors should apply a lower multiple for these earnings.
Growth Capex Mismatch
NMC’s growth capex for FY’18 ($101m) was a significant jump relative to FY’17 ($31m) and was explained at the results presentation as shown in Exhibit 1. We are struggling to reconcile this growth capex with what we saw when we visited the ongoing projects and our estimates of the cost of the projects outlined.
Exhibit 1: NMC’s $101m of Growth Capex for FY’18
Source: NMC FY’18 Presentation
Our independent estimate of the capex for these projects for FY’18 is no more than $30m and our calculation is as follows:
- Key expansion project
- <$5m for NMC Royal DIP expansion: There were a small number of workers onsite but little work looks like it has been done on this site.
- <$15m for NMC Speciality Dubai expansion: Whilst more progress has been made on this site, it is far from finished and was only partially constructed as of FY’18.
- <$5m for Mirdiff Hills: Work is not expected to start on this site until July 2019 and from trade websites we believe tendering for the fit out is yet to be launched.
We provide more details to support our estimated calculation below.
- Key projects completed
- <$2m for two new IVF clinics
- <$3m for upgrading the Oman facility
In the UAE, hospitals are either constructed from scratch (e.g. NMC Royal Khalifa City, Mediclinic Park View) or existing buildings, such as offices, are converted to be used as hospitals and typically leased (e.g. NMC DIP, NMC Royal Women’s). The cost per sqm is significantly lower on conversions: we estimate at 40-50% of the cost of newly constructed sites once fitted with medical equipment based on calls with experts within the industry.
Exhibits 2 and 3 show the breakdown of our estimated $2-3k per sqm total capex for a greenfield site and $1,600 per sqm for a refurbishment. We have supplemented this analysis with several expert calls.
Exhibit 2: The Analyst Estimates of Capex per Sqm

Source: The Analyst Estimates, Completed July 2019
Exhibit 3: Actual Capex per Sqm on Projects

Source: Company Data, The Analyst Estimates, Completed July 2019
1. NMC DIP Extension (~$5m)
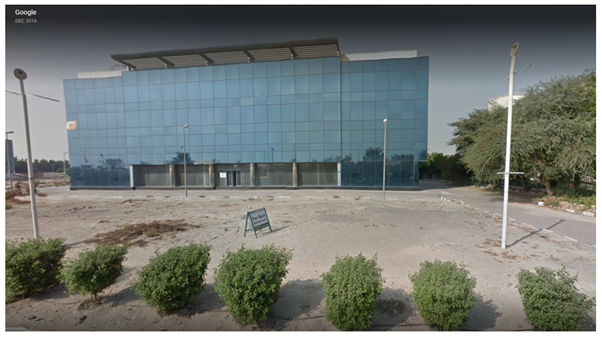
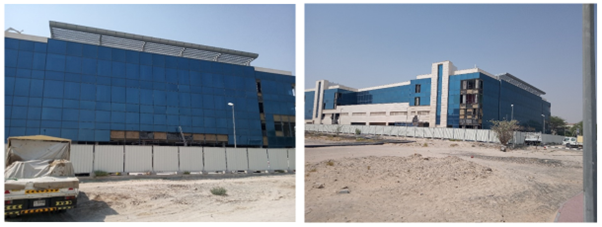
When we visited the NMC DIP Extension site, it looked like minimal capex had been spent on this site. It looked virtually unchanged from the Google Maps image from 2016, before NMC leased the asset (Exhibits 4 and 5). It does not look like extensive internal works have been made and we estimate less than $5m of capex would have been spent on this site as of FY’18.
We estimate that the cost to get this site operational would be ~$17.5m: we estimate that the building is 10,000 sqm, the cost to convert it is $1,000 per sqm, and it could be fitted with medical equipment for ~$750 per sqm.
Exhibit 4: NMC’s DIP Extension in 2016 before NMC Leased the Building
Source: Google Maps, Accessed on 20 June 2019
Exhibit 5: Little Change from On-the-Ground Visit
Source: The Analyst Lens 18 June 2019
2. NMC Specialty Dubai Extension (<$15m)
We estimate <$15m of capex would have been spent on this project as of FY’18. Unlike some of NMC’s hospitals, NMC is paying for the construction of the building.
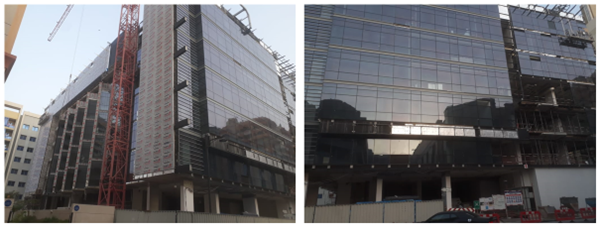
We have plotted the total land footprint and estimate it at 2,000 sqm with seven storeys, making it a total 14,000 sqm of floor space when finished. As shown by the images below the shell and core of the building was not yet complete when we visited it on 18 June 2019. We estimate only four floors of the seven-floor building were complete as of FY’18 from satellite images and trade websites.
Our calculation of less than $15m of capex spent on this project up until FY’18 is as follows:
- $42m project value (14,000sqm x $3,000 per sqm)
- 40-50% of project value is the shell and core (structure, façade, and mechanical elements)
- 30% of shell and core complete as of FY’18. From our due diligence, we believe only the shell of 4 of the 7 floors were constructed as of FY’18 with the façade, roof, interiors, and all the mechanical services to be added.
Exhibit 6: Shell Only Now Nearing Completion as of 18 June 2019
Source: Google Maps, Accessed 20 June 2019 and The Analyst Lens 18 June 2019
3. NMC Mirdiff Hospital (<$5m)
NMC confirmed it will be leasing a building on a new high-end development in Dubai (Mirdiff) for a 100-bed greenfield site, although work is not expected to start on this project until July 2019. NMC will only be paying for the fit out of this building (confirmed in an email from IR on 20 June 2019). Therefore, the total capex incurred until FY’18 would be for fees paid up until that point, which we estimate at less than $5m.
Conclusion
The projects outlined at the FY’18 presentation come in our estimates to less than $30m, leaving potentially $71m of unexplained growth capex that NMC was unable to confirm. We have spoken to the company about our concerns (26 June 2019) and the company would not provide further granularity on the three core capex projects and are keen that we emphasise that these figures reflect The Analyst estimates and not NMC’s.
UAE Market Is Saturated and More Capacity to Come
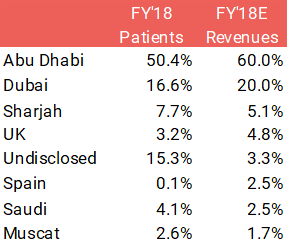
NMC does not disclose revenues by country, but from its ESG report, we can deduce approximately where NMC generates most of its revenue. We estimate NMC’s core revenue-generating geographies are as follows: Abu Dhabi (~60%), Dubai (~20%), and other regions (~20%).
Exhibit 7: Patient Split and Revenues Estimated by The Analyst
Source: NMC ESG Report 2018
Our work on the Abu Dhabi market suggests it is saturated, with more capacity coming. Despite Emiratis (locals) only accounting for 18% of the population, we estimate they account for >45% of the total hospital revenues. The number of insurance incidences per Emirati is double the number of insurance incidences compared to the rest of the expat middle-income Abu Dhabi population.
We believe over-testing is a significant problem in the market, especially amongst the Emiratis, as no patient is going to refuse what they perceive as a better service (given it is free). This makes Emiratis very attractive customers, but as we discuss below, is unlikely to be sustainable as the health authority clamps down.
Given the potential issues faced in Abu Dhabi, Dubai is a region of growing importance to NMC with 310 beds coming online in the next couple of years (Exhibit 1). We see the Dubai market as less attractive given its lower proportion of Emiratis (9% of the population) and the insurance coverage for non-government employees is a lot less generous with 10% co-payments in private hospitals discouraging patients from visiting hospitals for minor ailments.
In Saudi Arabia, NMC has 664 beds, although occupancy rates are lower (excluding the CARE properties). We see the market remaining tough for several years driven by regulatory change and an oversupply of beds. We believe the objectives of General Organization for Social Insurance (GOSI) are different from NMC’s. In the Memorandum of Understanding signed with GOSI, the JV targets to spend $1.6bn over the next five years ($320m a year), which will translate to $163m per year for NMC’s share in the JV, continuing to drain cash flow.
Abu Dhabi (~60% FY’18 Healthcare Sales)
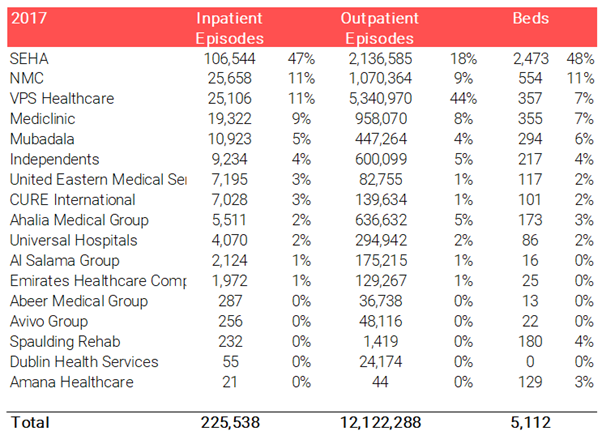
NMC’s position within the Abu Dhabi market is quite strong, being the largest group after SEHA, the government-run hospitals. But it is far from dominant as VPS and Mediclinic have similar market shares. The market in our opinion suffers from two issues:
- Saturation, with capacity still coming into the market.
- Over-testing of patients that the government is looking to stop.
Overcapacity in the Market
The number of inpatient beds is a good metric to assess overall capacity within the market. The number of beds across the whole region has increased by 35% in 3 years (June 2014-June 2017) with considerable capacity coming into the market from both the expansion of existing hospitals and creation of new hospitals. We see the number of inpatient beds across the region increasing ~ 10% per year. We do not believe the market can sustain that level of supply growth and do not see NMC benefiting from the increased specialisation.
Exhibit 8: Abu Dhabi Hospital Group Market Share
Source: HAAD Statistics 2017, The Analyst Estimates, Completed July 2019
Over-testing of Patients
We believe the government recognises the over-treatment of patients and is actively looking to reduce it. The government began by introducing a co-pay for Emiratis patients (which we believe accounts for >45% of hospital revenues), whereby the patient would have to pay 20% of the treatment costs at private hospitals. However, the Emiratis were not happy and the change was quickly rolled back. Still, since then, the Health Authority of Abu Dhabi is stepping up the monitoring of doctors, blacklisting those that are clear outliers in terms of statistics, and closing hospitals that consistently may abuse the system. From our expert calls, we understand the government has also been pushing down prices for procedures.
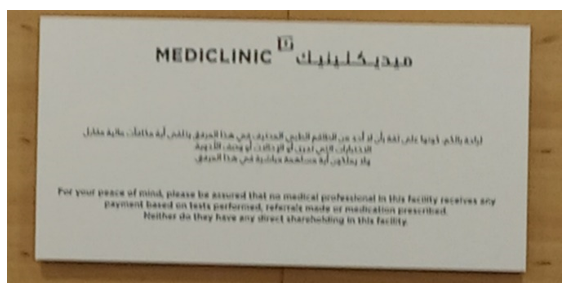
A large part of the over-testing problem is the incentives in place; it is widespread within the industry in Abu Dhabi that doctors receive a cut of the revenue they undertake, incentivising unnecessary testing and treatment. Mediclinic highlights that it does not participate in such activities and whilst we believe NMC does provide some incentives to doctor based on medical KPIs (e.g. medical satisfaction etc.), we do not think it is unique in doing this. Long-term, we see the government continuing to clamp down on such incentives. Ultimately, we believe this could have consequences on NMC’s margins as, if the company is undertaking excessive testing, it is likely to come through at a high margin.
When we raised the subject of over-testing with NMC on our call on 26 June 2019, management told us that doctors receive a base salary and incentives are based on KPIs such as patient satisfaction, not revenues.
Exhibit 9: Mediclinic Highlights Its Ethics at Parkview: ‘No Doctor Receives Any Payment on [Procedures]’
Source: The Analyst Lens 18 June 2019
Dubai (20% of FY’18 Healthcare Sales)
With the Abu Dhabi market more saturated, NMC has been shifting its focus Dubai. NMC has 350 beds planned over the next couple of years, adding ~7% to the whole market. There are a couple of reasons why we think this expansion will dilute margins:
1. Given the fixed cost nature of running hospitals, large capacity growth in the Dubai market is likely to outstrip demand growth, lead to lower occupancy rates, and reduce margins.
2. Dubai market does not benefit from the Abu Dhabi equivalent of Thiqa (highest-margin patients and over-users) and thus will be a less profitable market.
Large Capacity Growth in Dubai
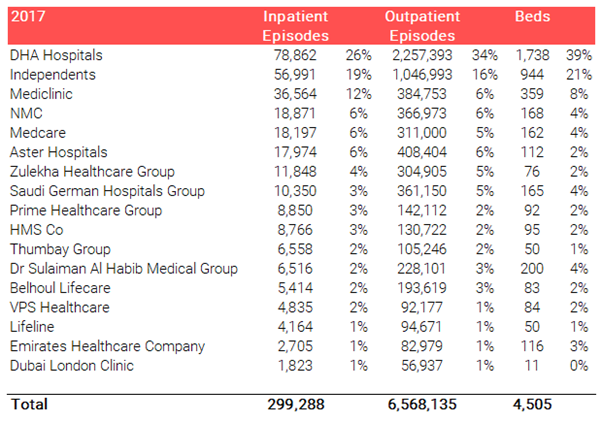
NMC’s market positioning within this market is weaker, with an estimated 6% of the outpatient and inpatient market as of 2017.
Exhibit 10: Dubai Hospital Group Market Share
Source: DHA Statistics 2017, The Analyst Estimates Completed July 2019
There are currently 41 hospitals in Dubai (35 private and six public), up from 32 total hospitals in 2017. Within the next two years, the total number of hospitals is expected to increase to ~42 and nine are expanding, adding large bed capacity to the market. We believe this will cause pressure on margins, leading to an oversaturated market, lower occupancy rates, and lower margins for all players. The basis of this assumption is:
- 5-7% underlying market growth is driven 50/50 between population growth and additional higher value specialist services.
- 10-15% annual capacity growth over the next couple of years.
Small Thiqa Equivalent
Only 9% of the population are Emiratis and less than 40% of those benefit from a very comprehensive insurance plan equivalent to Thiqa (Enaya), which is reserved only for government officials. The remaining Emiratis are entitled to Saada insurance, which requires a 10% co-payment, limiting the willingness for patients to go for unnecessary tests and treatments and making this market less attractive than when serving the Thiqa patients in Abu Dhabi. This can be seen in the number of outpatients in the Dubai market, which is half of Abu Dhabi despite it having a similar population.
Structural Reasons Why the UAE Has Low Spending per Capita
The UAE’s relatively low spending on healthcare at $1.7k per capita versus the UK and Germany at $3.3k and $4.7k is seen by investors as an exciting opportunity for growth; however, we are less optimistic in the medium term. The over-65 population is much smaller at 1.2% in Dubai and Abu Dhabi versus 18% in the UK and 21% in Germany, and their relative spending on healthcare is 2-2.5x that of the under-65s. The unwillingness of expats to remain in the country during retirement is unlikely to change anytime given the visa requirement to own property in excess of $550k in order to obtain an extended residency visa.
Saudi Arabia (2.5% of FY’18 Healthcare Sales)
We believe this market will be tough for NMC for several reasons:
- The number of beds per 1,000 people is already higher than the UAE at 2.2 versus 1.3 and not far away from the UK (2.6 beds per 1,000 capita). The Saudi population, like the UAE, is relatively young with only 3% of the population over 65 —meaning the number of beds per capita should be lower than a county like the UK where it is 18% (explained above).
- The GDP per capita in Saudi is only $21k versus Abu Dhabi at $61k, implying healthcare spending in absolute terms will be much lower.
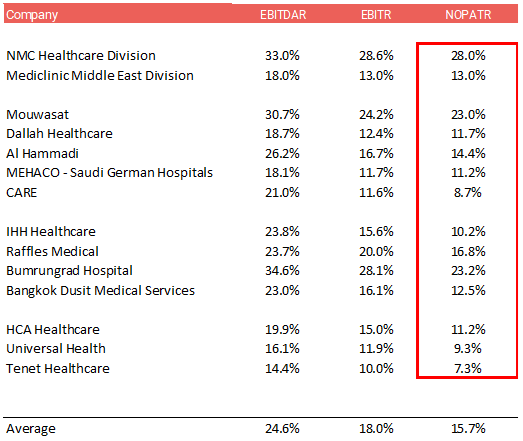
- There are many competitors with four listed players (excluding Care) in Saudi today, generating only 14% margins (NOPAT pre-rental) versus NMC’s 28% given the headwinds with Saudisation program and a fall in the expat population caused by the expat levy.
NMC and its joint venture partner, the General Organisation for Social Insurance, has big plans for the Saudi market, with the target for NMC to spend $163m per year in expansion, which will continue to put pressure on cash flow.
Whilst we see the market as tough and highly competitive, we do acknowledge the government is keen to push further privatisation of the sector. In time, this could lead to further growth for private hospital groups, which is expected to be beneficial for NMC.
Margins Too Good to Last
- NMC’s margins relative to local and international peers are exceptionally high at almost double (NOPAT pre-rental expenses, adjusted for overheads).
- These margins are even more impressive given the growth that NMC has seen over the last five years; typically operators sacrifice margin when growing aggressively.
- We do not believe these margins are sustainable, especially given they have been achieved with higher invested capital turn and also because NMC leases most of its assets.
Exhibit 11: Exceptionally High Margins Despite Aggressive Expansion
Source: Annual Reports and The Analyst Estimates, Completed July 2019
Increase in Other Income Is a Red Flag
NMC generated $89m from ‘Other Income’ in FY’18. We have several concerns around ‘Other Income’:
- ‘Non-promotional’ other income jumped 5x to $34m with only $6.4m explained in the audited accounts as arising from contingent consideration. The company has since informed us (26 June 2019) that only ~$16.4m of the $33.9m flowed into EBIT, and this amount arises from: $6.4m from the reversal of the contingent consideration, $5m of ‘normal other income’, and $5m from a one-off ‘Aspen medical contract’. The balance of $17.5m is related to income in O&M contracts that have associated costs in SG&A. Whether 50% or 100% of it came into EBIT, the ‘Other Operating Income’ has increased substantially and investors should pay a discount for this income stream.
- The remaining $55m relates to promotional reimbursements in relation to distribution agreements with suppliers. That is a large sum relative to the revenues (11%). We were informed that these relate to reimbursements from FMCG suppliers. However, we believe, based on historic disclosure, that 30-40% of revenues within distribution related to FMCG, implying ~30% of the price of the FMC goods sold by NMC is marketing expenses. We see this as exceptionally high.
Exhibit 12: Other Income Increasingly Contributing to EBIT

Source: DHA Statistics 2017, The Analyst Estimates, Completed July 2019
Actual Net Debt versus Reported
NMC’s reported net debt ($1.5bn) versus what we calculate as the underlying net debt ($1.9bn) is shown below with $203m of liabilities due this year. Most of these are one-off in nature and hence are likely to cause a working capital outflow in FY’19. This combined with the margin declines we are forecasting and the guided growth capex of £100m in FY’19 would result in minimal FCFE generation. FCFE would actually turn negative once the Saudi JV investment and continued acquisition spending is included, ultimately requiring NMC to take on more debt.
Exhibit 13: The Analyst Estimate of Net Debt
Source: The Analyst Estimates Completed July 2019
Conclusion
As our work on NMC continues, we are gaining conviction in our short case given increasing concerns on cash flow, capex numbers, evidence on the ground, and the unsustainability of margins.
We decrease our target price to £13.50, providing ~45% downside from here.
Appendix: NMC’s Assets
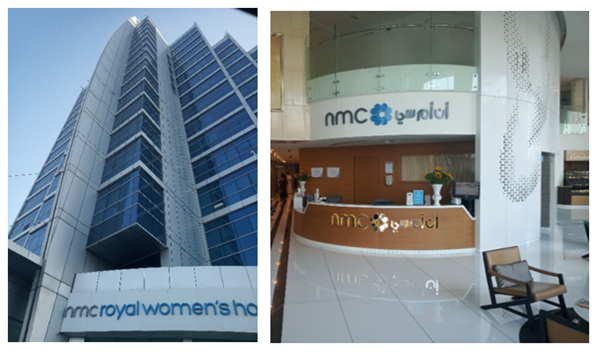
Appendix Exhibit 1: NMC Royal Women’s Hospital
Source: The Analyst Lens 18 June 2019
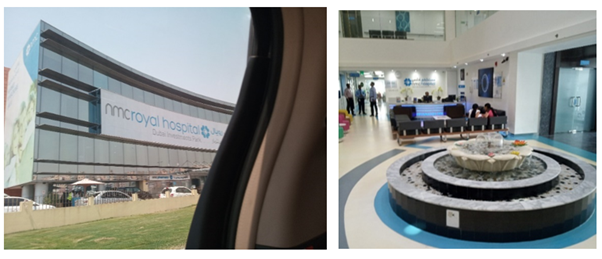
Appendix Exhibit 2: NMC DIP
Source: The Analyst Lens 18 June 2019
Appendix Exhibit 3: NMC Royal
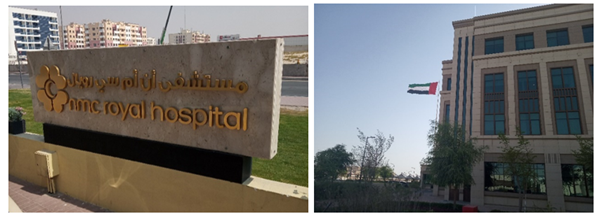
Source: The Analyst Lens 18 June 2019
Appendix Exhibit 4: NMC Speciality Abu Dhabi
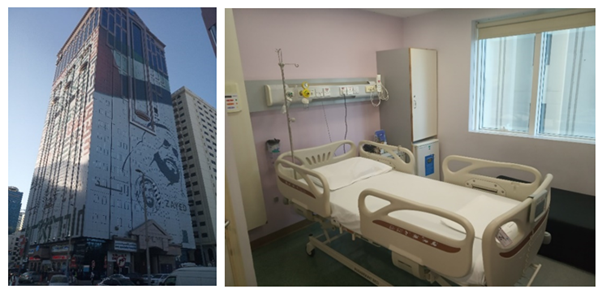
Source: The Analyst Lens 18 June 2019
Appendix Exhibit 5: NMC Provita

Source: The Analyst Lens 18 June 2019