Recommendation: Buy (Initiation of Coverage)
NOK --
$31.1m
Price/Mid-Cycle Earnings
NOK --
NOK 103bn
8x
58%
YAR:NO
12x
Investment Thesis
- Global fertiliser cycle is strengthening on supply/demand rebalancing, with benchmark prices up 50% from the lows and no meaningful supply coming to the market in the next few years. The Chinese are out of the export market, which is likely to become structural for the first time in the industry.
- Yara will realise value through portfolio refocusing and is at the inflection point on cash flows and net debt, with pressure from activists to crystallise value in asset base.
- Yara is a well-managed, vertically-integrated, large fertiliser business that makes consistent return on capital and invests counter-cyclically (cost savings, capacity expansion, M&A). The upside lies ahead now on efficiency programs and expanded production projects.
- Trading below replacement cost, and small premium to heavily-depreciated net book value, with upside to NOK 60 EPS, from NOK 14 in 2017.
- We initiate with a price target of 58% upside based on 10x mid-cycle earnings and 2x book value, or 1x real replacement cost.
The global fertiliser cycle is likely to strengthen in 2019, and the major global comps have changed tone during Q2’18 and Q3’18 reporting (Mosaic, for example, raised guidance on better Potash and Phosphate markets, whilst CF has been quite bullish all through the year). This is due to minimal supply additions in the coming years, set against a reasonable demand backdrop and slightly better crop prices. This next cycle will be fundamentally different to history, in that the Chinese exporters have structurally departed from the market. This means things can get very tight, especially if China becomes an importer, but the global cost curve also moves down structurally. A good time to own cyclicals is when they aren’t making any money, and are burning cash. Yara is at that inflection point. The stock has been fairly resilient in 2017-18 despite reporting poor earnings – we feel this is a cyclical stock investors can buy today, despite the broader backdrop in other cyclical sectors which have enjoyed peak margins in recent years.
Yara-specific, there are strong legs to our investment case — namely the portfolio refocusing and value realisation (helped by management’s new strategy and some activist shareholders), the peak of capex and net debt, the self-help measures (efficiency projects), and production expansion on recent investments.
Analysts usually underestimate an earnings cycles in both directions. Yara can make NOK 60-70 in the medium term, from NOK 14 in 2017. On a mid-cycle basis, Yara has earnings power of NOK 40, putting the stock on a low multiple, with upside on a cyclical recovery in earnings driven primarily by better pricing.
Yara is also a good business and has consistently returned a premium on the cost of capital across business cycles. This is because it is large, vertically-integrated, well-managed, and sells value-added fertiliser blends and production with flexible capacity. The industrial business delivers consistent profits whilst the production division has been loss-making recently. We keep OCI N.V. on our Buy list alongside Yara – the latter is a fresh idea and significantly more liquid for clients.
Buy Cyclicals When Margins Are Low
Exhibit 1: Yara’s Operating Margin 2004-2020e
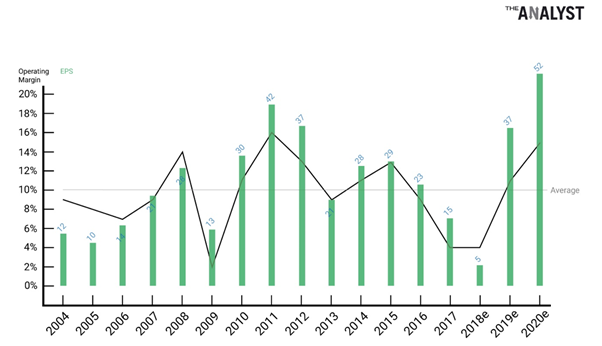
Source: Company Data and The Analyst Estimates, Completed November 2018
Lucky 7: Our Key Reasons to Buy Yara Now
1. Earnings Can Quadruple to NOK 60, Understated Book Value
- Yara made $2.5bn EBITDA in 2015 and between $2-2.7bn during the 2011-15 timeframe, prior to the pricing decline and energy cost increases between 2016-18.
- Taking this baseline, adding the $1.1bn internal measures, and noting the higher production and price recovery underway, Yara can make $3.5bn EBITDA, which is equivalent to NOK 60 EPS.
- Yara reported NOK 14 EPS last year (FY’17) and investors can potentially enjoy a quadrupling in the coming years. The stock would work well against this backdrop.
- On a maintenance capex basis, Yara was break-even on free cash flow last year and has reported $100m net income or lower in eight of the last 10 quarters. A fair ‘trough’ earnings for Yara is ~$400m net income, or NOK 12. Yara is closer to trough earnings and essentially reported no profit in 2018 (including the special items and FX hedging costs in Q2’18).
- On 10x PE, we set a NOK 600 price target on the stock, offering 58% upside for clients on a large, liquid, somewhat contrarian name.
- NOK 600 price target would represent a market cap of $20bn, and we forecast Yara to be making a 20% ROE and pre-tax ROIC at NOK 60 mid-cycle earnings ($3.5bn EBITDA). As noted in our previous work on Yara, the net book value (depreciated PPE) understates the replacement cost or underlying asset value of the business — particularly considering that Yara is large, well-invested, and has integrated assets with terminal and distribution capacities and an industrial business on top of the core fertiliser production assets.
- Yara’s gross PPE value is $14bn, with accumulated depreciation of $6bn (net PPE of $8bn). In an improved market environment, and if there is some M&A, Yara will become assessed on replacement cost. We estimate Yara’s replacement cost to be at least $15bn, compared to the market cap today of $12bn. In addition, investors get the benefit of reducing net debt, typically accruing to the equity value in a cyclical.
- Investors should also note that Yara is a little more than a commodity fertiliser producer. The company has 15-20% of revenue in the Industrial division, which is far less volatile and consistently reports EBITDA margins above 10% and ROIC of 20%. The downstream crop nutrition division is exposed to value-added blends with good market positions, whilst the real volatility comes in ‘production’ where Yara has 70% of the fixed assets and EBITDA margins declined from 23% in 2011 to 12% (Q3’18), which is essentially renders the company loss-making in basic fertiliser production.
2. After 2018, Supply Growth Should Decline
Exhibit 2: Supply Growth Is below Demand Growth from Now On
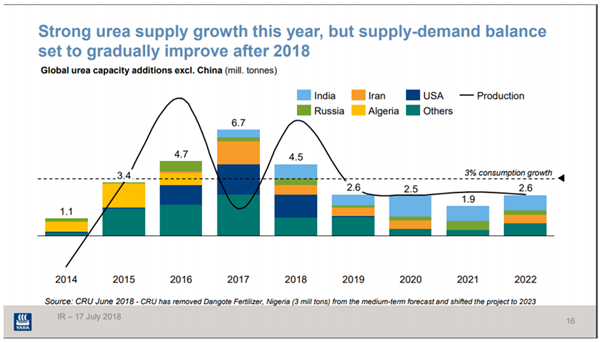
Source: Yara Q2’18 Presentation, Slide 16
3. Buy Cyclicals at Trough Margins
- Investors should buy cyclical businesses when things are tough, margins are low and fundamentals are weak. This has been the case in fertiliser since 2016. Yara will report a 4% margin this year. It has only ever been lower in 2009.
4. Prices Are Up Significantly
- Yara reported higher realised prices (for example, Nitrate prices +9%, and NPK +8%). However, the higher gas prices in Europe create strong headwinds, meaning prices are likely to rise further. At the end of Q3’18, for example, Nitrate prices were +18% exiting the quarter.
- Yara has a lag on pricing and reported a $20/ton premium on Nitrates in Europe in Q3’18, relative to a $50 premium on current deliveries (~$40m uplift to EBITDA in a quarter). Industrial Urea also runs with a three-month average moving price. Yara’s numbers are still lagging current market prices, and analysts are behind the curve.
- Essentially, investors are now in the first quarter of a multi-year upturn in earnings.
- Yara increasingly believes Chinese changes are structural. This takes the highest-cost producers out of the market, thereby flattening the global cost curve somewhat, but removes the prospect of Chinese exports in the event of a tight pricing cycle. This means the next cycle could even be tighter, for longer, with no prospect of new supply coming on stream in the coming years. The US remains a net importer. Yara is slightly disadvantaged against previous cycles as European gas prices exceed US prices, and Yara has most production in Europe.
- Urea prices are up strongly and this has not triggered a supply response from China. 90% of Chinese capacity produces from coal, which is less efficient than gas. New capacity has been added in lower cost, ‘cleaner’, thermal coal, but it is near to the coal source, inland, and has high logistics cost to reach the export market. Anthracite coal is still the largest part of Chinese capacity and this is old, small-scale, and polluting. China has prioritised gas allocation into other industries, away from fertiliser production.
- Chinese prices are $330-340, Egypt is around $330, and Inland Europe $370. Yara reported average Urea pricing of $293 in Q3’18. Urea is the basis product we are concerned about here, and is the reference point for the industry. We should note that Yara is selling higher grade, blends, and mixes, but price trends should be broadly similar.
- Yara gives sensitivities to fertiliser prices in its slide deck. Here we show the evolution from 2013 to 2018. Investors should also consider the structural improvement in the market with Chinese production rebalancing on environmental closures, the increased size of the company, and increased production measures since the older presentation.
- $100 on Urea from the 2016-18 lows ($250 to $350 assuming LFL gas costs) adds NOK 12 to earnings, as shown in the slides below. $100 on CAN adds NOK 20 and expanding NPK premiums add NOK 1.3 EPS for every $10 improvement.
- Yara first needs to recover higher has costs and faces another $125m headwind in Q4’18 (compared to $108m in Q3’18). However, prices are past the point of recovery now. In a stable energy cost environment, Yara is set for a great 2019.
Exhibit 3: Yara Provides Sensitivities to Fertiliser Prices, We Compare 2018 and 2013 Below
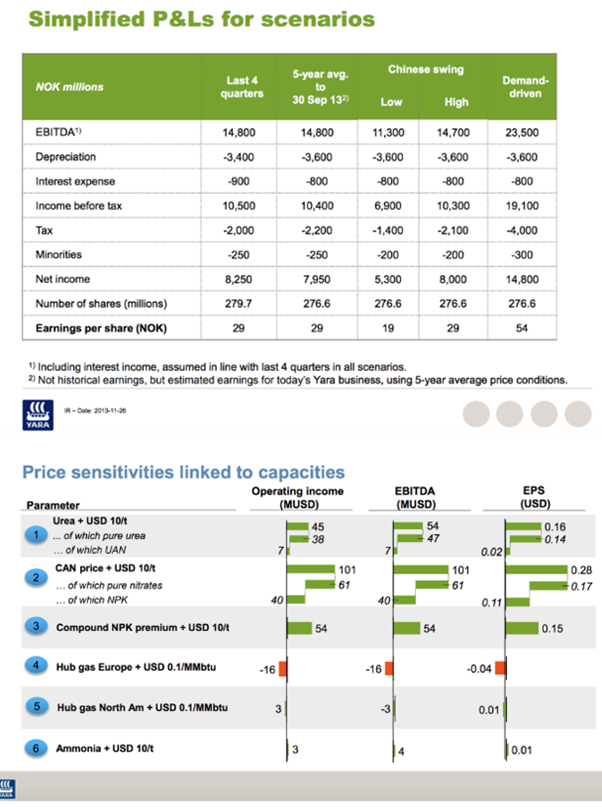
Source: Yara Company Data 2013 and 2018
5. Self-Help and Volume Expansion
Exhibit 4: Self-Help Measures on Cost and Production Are Significant
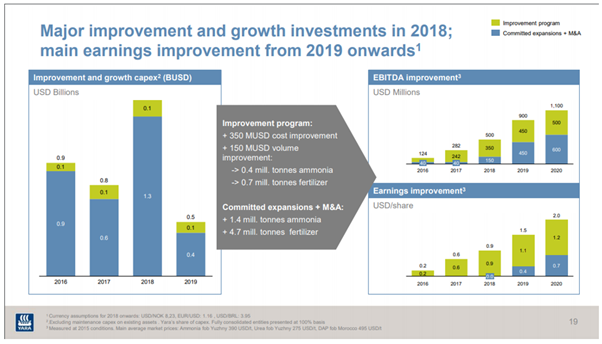
Source: Yara Q3’18 Presentation, Slide 19
- On a 2015 baseline ($2.5bn), Yara has a $1.1bn improvement program from cost and production expansion. In 2018, Yara will report ~$1.5bn EBITDA. With 2015 pricing recovered, Yara can easily double EBITDA in the next year. In fact, fertiliser pricing has now recovered to 2015 levels, but the gas price is significantly higher (Yara faces a 30% higher global weighted average gas cost). With the tighter supply, China out of the export market, and steady demand growth, higher prices are becoming more likely and these help Yara retain cost savings and production expansion benefits for cash flow to shareholders.
- We expect Yara to hit $350m cost improvements this year and have executed well — even in a downturn — on cost efficiency, which is essential and testament to quality of management. The total plan of $500m represents a large sum of ~20% improvement on the baseline EBITDA of 2015, when the program started, by 2020. Although we do not recommend investors buy cyclical businesses for cost-cutting, the stronger pricing environment obviously helps Yara retain these cost measures for the benefit of shareholders. Higher gas costs also impair the improvement plan due to utilisation rates in certain plants, whilst the higher costs also offset the benefits of the plan in the earnings performance.
- Within the improvement program, $150m is planned to come from volume improvement (production efficiency) with 0.4mt ammonia and 0.7mt fertiliser added (at 2015 prices). The production expansion program will add 1.4mt ammonia and 1.7mt fertiliser, effectively 15% to Ammonia production and 10% to fertiliser production over five years. Higher prices simply mean shareholders get this benefit, whereas under 2017 pricing, it would have been hard to see the earnings accretion of these internal measures.
6. Capex Peaked in H1’18/Cash Flow Inflection Point
Exhibit 5: Yara Is about to Enter the Cash-Harvesting Phase
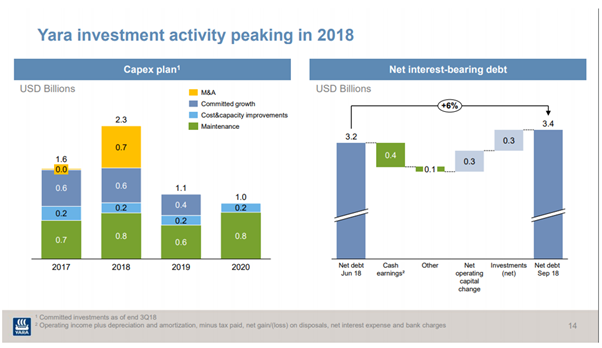
Source: Yara Q3’18 Presentation, Slide 14
- Yara invested almost $4bn in 2017 and 2018, with $1.6bn on growth projects and capacity improvements alongside $0.7bn on M&A (maintenance capex is guided to be $0.7bn p.a.).
- Therefore, from a 2018 capex number of $2.3bn, Yara is predicted to invest $1.1bn and $1bn in 2019 and 2020, respectively. This is a broad industry trend, with supply additions coming online industry wide between 2014-18, no major projects scheduled, and all large players trying to enjoy a cash-harvesting phase. OCI is at a similar, more extreme, inflection point on free cash flow and debt reduction.
- Net debt has risen from $1.4bn to $3.4bn since 2014 as Yara has broadly been only slightly free cash flow positive since 2014 (and consumed cash after paying for dividends and M&A). In the meantime, EBITDA declined, taking leverage up to 2.4x ND/EBITDA. Typically, cyclicals are good to own as an equity holder when they are de-levering the balance sheet.
- Free cash flow will improve to $1.7bn at NOK 60 EPS (a good mid-cycle earnings performance). 2019 will see an immediate improvement in free cash flows (we forecast $600m) compared to nothing for four years from the company. This opens up balance sheet capacity for higher dividends and buybacks, particularly if assets are also being disposed as discussed below.
7. Activism and Strategy
- Yara revisited the broader strategy earlier this year for the first time since 2012, focusing on three strategic priorities: 1) advance operational excellence, 2) drive innovative growth, and 3) create scalable solutions. As part of this review, there is a renewed focus internally on portfolio focus.
- Yara has also become the subject of some shareholder activism, although the Norwegian government has a huge blocking stake in the company (Ministry of Trade has 36%, the Government Pension Fund has 5%).
- Tor Olav Troim (Jon Frederiksen’s former right-hand man) has acquired a stake of ~NOK 1bn (1% of the company) and advocates some asset disposals and portfolio refocusing. We suspect he has a group of close friends in the Norwegian market who contribute to the pressure, thereby likely to become a more vocal force behind the share price. Balance sheets have not been stretched in this downturn in the cycle and there has not been financial distress. Therefore, M&A has not really occurred in a meaningful manner. The fertiliser industry is very fragmented globally, particularly in basic products such as Urea and Ammonia. Broader consolidation would be supportive of the investment case, and improving cash flows and asset rotations should become a feature in the next three years.
- The first candidate for spin-off is the Yara Marine Technology (YMT) business, which produced $76m revenue and $7m EBITDA last year. Revenue is growing >10% and the company has a $400m+ orderbook. A large element of the cost base is fixed, and we are pushing the company for further disclosure here. Yara sells and installs capital equipment to shippers for SOX/NOX abatement (removal of pollutants from industrial exhaust). Our initial estimate is that this is a $200-300m asset in a competitive bid process – although only 2-3% of Yara’s market cap, it reminds investors of some of the hidden assets in the portfolio.
- Another interesting asset is 25% of Qafco. Qafco has 3.7mt Ammonia and 5.7mt Urea, which would have a replacement cost of ~$1000/ton. Yara has a $1bn net book value position in the Qatari JV, accounted for at the associate line in the P&L (i.e. below EBITDA). We doubt the consensus really captures the value of this asset. Yara’s share of Qafco net income was only $20m (NOK 164m) last year, compared to $120m (NOK 960m) in 2013. This is a highly valuable asset with a low-cost gas position and a large, modern plant. However, there is only one buyer for the asset (the JV partner) at the time of this note.
- In our next note, we will dive deeper into Yara’s asset base and explore what else could be a hidden asset or potential for spin-off or disposal. We will also do more work around the industrial division to understand where the critical integration into the broader group lies.